First-time buyers facing soaring house prices are paying more to get less, new figures reveal.
The median home price has risen by more than a third to $442,500 in the past five years. But the average size of those sold has shrunk since 2019, as fewer large homes have come to market.
This means buyers are now having to pay 52.7 per cent more than they would in May 2019 for a home of the same size, and this is partly due to the rise in working from home.
“It’s important to pay attention to the price-per-square-foot metric,” says Ralph McLaughlin, senior economist at Realtor.com.
“The change in that metric is a stronger measure of how much more a home is worth over time than looking at changes in the median listing price.”
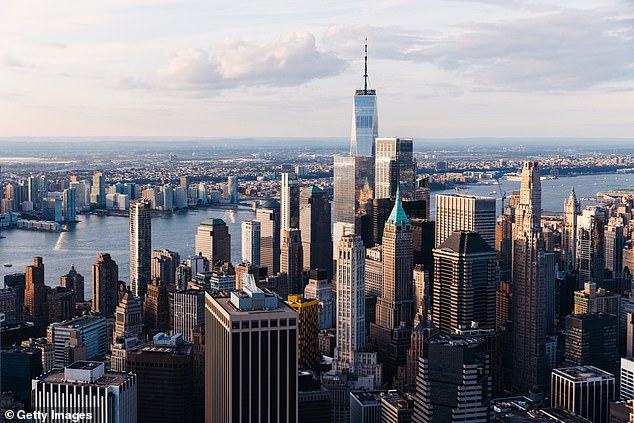
New Yorkers now have to pay 84 percent more than they would five years ago for a home of the same size, and the city tops the list for price increases per square foot.
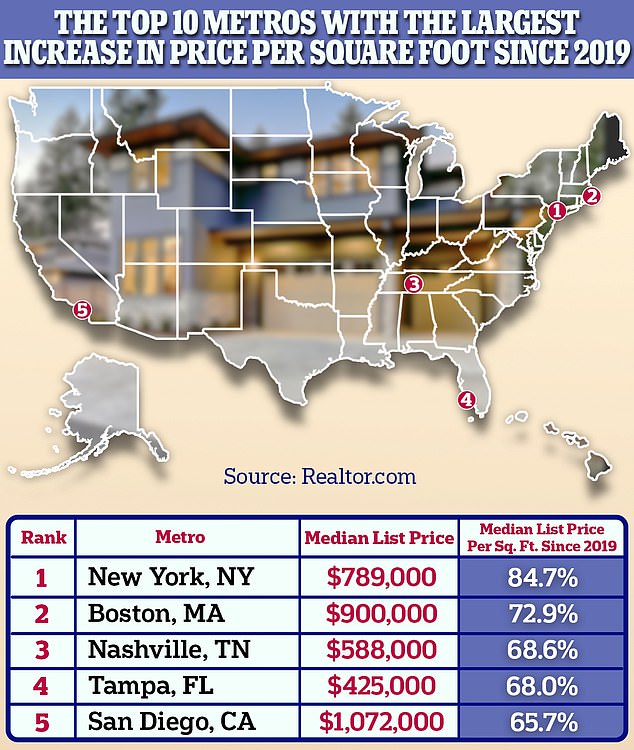
The trend can be seen across the country, but the hardest hit cities are Nashville, Tennessee, where the metric increased 68.6 percent, Boston, Massachusetts, where it increased 72.9 percent, and New York City , where it increased a surprising 84.7 percent. .
“As remote and hybrid work arrangements became more common, buyers flocked to areas that offered good value within a reasonable commute,” said Realtor Hannah Jones.
Boston will be the next city where buyers will need $1 million for the average family home after the typical price hit $950,000 last month.
But the top ten price-per-square-foot increases are dominated by southern cities, with Tampa, Florida, Austin, Texas, and Phoenix, Arizona all making the list.
“Buyers from expensive areas flocked to the affordable metropolitan areas of the Sun Belt,” Jones said.
‘Incoming demand caused low inventory and increased prices. Although inventory levels have recovered significantly in the area, home prices have not softened.
A perfect storm of spiraling construction costs, desperate buyers, and existing homeowners sitting on their homes has caused home prices to double in 68 of America’s 100 largest cities in less than ten years.
This is despite the average rate on a 30-year fixed-rate mortgage hitting seven percent – a 23-year high – as authorities try to squeeze inflation out of the economy.


Realtor.com senior economist Ralph McLaughlin warned buyers to pay attention to this under-considered metric, while his colleague Hannah Jones blamed the rise of home offices for the rise in prices.
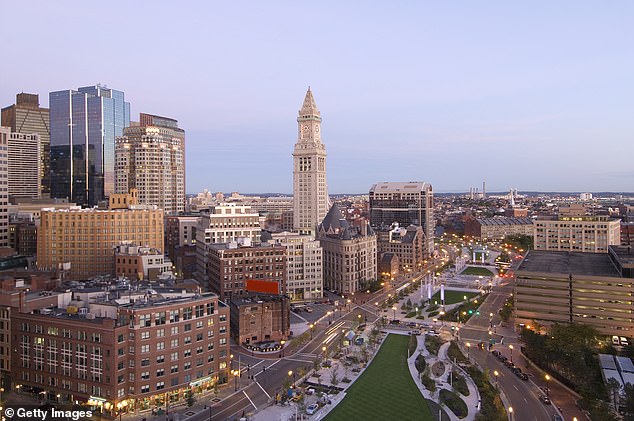
Boston, Massachusetts, ranks behind New York on the list, posting a 72.9 percent increase.
The fastest increase occurred in Detroit, where it took just 4.9 years for the average home to double in value.
But there are bargains in the Motor City, where the price per square foot has increased a modest 23.2 percent since May 2019.
Baltimore in Maryland and San Jose in California also underperformed in land grabs nationally with increases of 24.8 percent and 26.3 percent respectively.
Jared Wilk of the Greater Boston Association of Realtors warned that a decade of ultra-low interest rates has left existing homeowners unwilling to move house and take on new mortgages at much higher rates.
And that has left buyers desperately competing for the few homes that come on the market, with more than a third of homes paid for in cash.
“The reality is that if rates go up or down, if more homes or less come on the market, prices are going to go up,” Wilk told the Boston Globe.
“There is a lot of pent-up demand and an imbalance in supply that will continue to drive them up.”
Realtor counted 788,000 homes on the market in May, compared to nearly 1.2 million in May 2019.
“We expect a still sizable gap between 2024 housing inventory and the pre-pandemic housing market to persist, as it closes only gradually,” he wrote in his monthly housing market survey.
‘The growth of homes priced especially between $200,000 and $350,000 outpaced all other price categories.
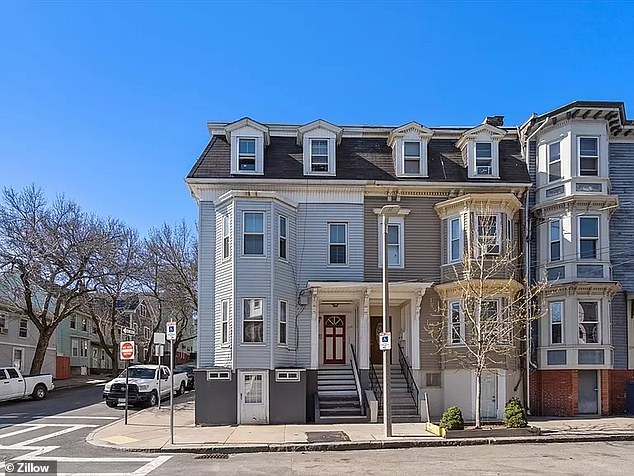
Pictured: It now takes $1 million to buy this average single-family home in East Boston
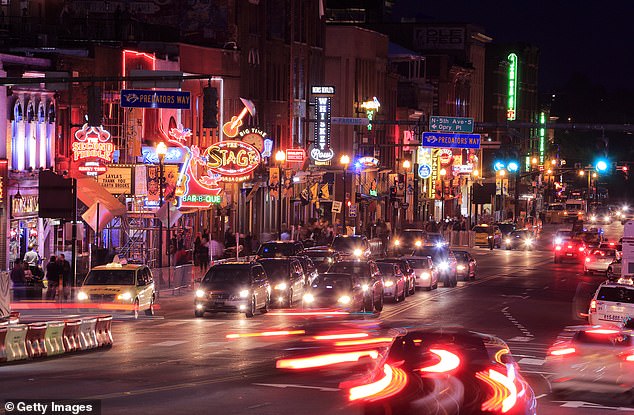
But most of the list is dominated by southern cities, and Nashville, Tennessee, saw a 68.6 percent increase in price per square foot.
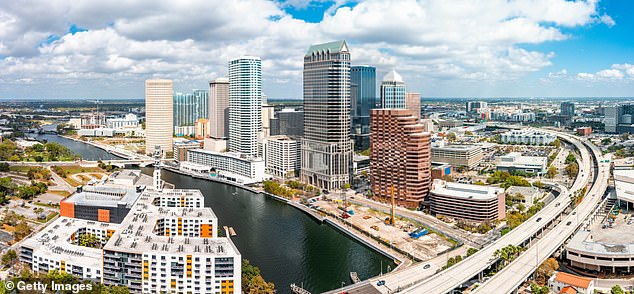
Tampa in Florida is just one step behind with a 68 percent increase.
“This increase is again primarily due to greater availability of smaller, more affordable housing in the South.”
But forecasters at financial analysis firm CoreLogic expect prices to fall in southern areas over the next year.
The Palm Bay-Melbourne-Titusville and Deltona-Daytona Beach-Ormond Beach regions of Florida are likely to see price declines, along with the Atlanta-Sandy Springs-Roswell region of Georgia.
“While the housing market is still in seller territory, it is expected to shift in a buyer-friendly direction as mortgage rates resume their decline over the next year and the number of homes for sale increases,” Realtor wrote.

