Your chances of developing Alzheimer’s may depend on your zip code, a new study says.
Researchers at the University of Michigan found that someone living in a city in the same state could have twice the risk of being diagnosed with this memory-impairing disease, compared to someone living in cities farther away.
The team said the disparities between states are likely a result of dementia being overlooked. They blamed variations in screening and testing, lack of uniformity in medical care and education, and differences in people’s willingness to see a doctor.
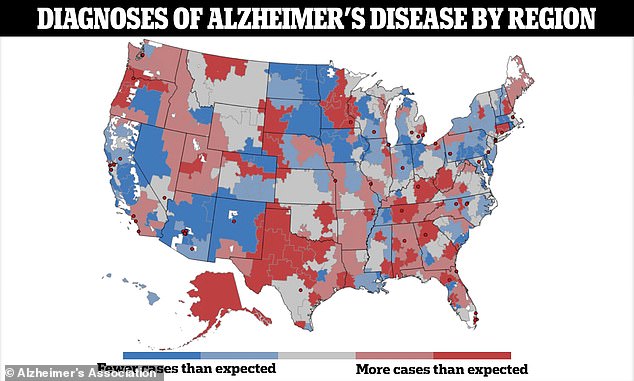
The map shows more than 300 different hospital regions, and in each one, a ratio that reflects the actual number of Alzheimer’s cases compared to the number of cases that would be expected to occur. The same person would be up to twice as likely to receive a dementia diagnosis in some areas of the U.S. than in others.
The overall concentration of Alzheimer’s diagnoses was in the South, along the so-called “stroke belt,” where the population has a higher rate of cardiovascular risk factors.
But even there, there was a heterogeneous quality that researchers say could reflect disparate levels of general health awareness and the signs of illness to look for.
Dr. Julie Bynum, a geriatrician and health researcher at UM Health who led the study, sayingThese findings go beyond demographic and population-level differences in risk, and indicate that there are differences at the health system level that could be addressed and remedied.
‘The message is clear: From place to place, the likelihood of being diagnosed with dementia varies, and that can happen due to a variety of factors, from health care providers’ practice standards to individual patients’ knowledge and care-seeking behavior.’
This mosaic may reflect undiagnosed and under-served populations, as well as differences in the way physicians practice across regions.
Doctors in some areas may be more proactive in diagnosing Alzheimer’s than those in others, for example.
This could also mean that patients in some areas are less likely to visit the doctor than people in others and therefore do not receive a diagnosis.
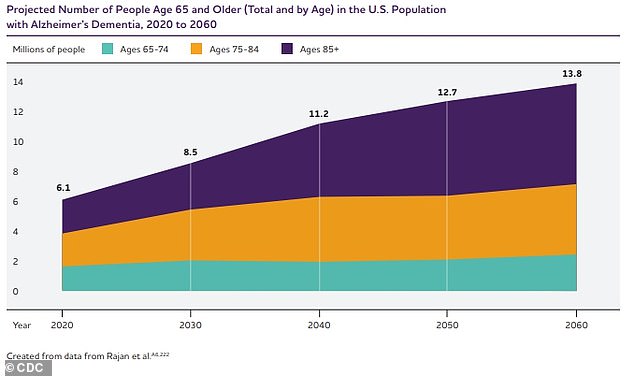
The number of Alzheimer’s patients is expected to rise from 6.7 million today to nearly 13 million by 2050, so addressing the factors that cause disparities between ZIP codes could have a huge impact on public health, the team said.
Researchers who conducted the study began by analyzing 2018-2019 data from Medicare, the federal health insurance program for people age 65 and older, to identify cases of Alzheimer’s and other forms of dementia.

The number of Alzheimer’s patients is expected to increase from 6.7 million today to nearly 13 million by 2050.
Dr. Bynum said, “The goal today should be to identify people with cognitive problems earlier, but our data show that the youngest age group of Medicare participants has the greatest variation.”
“For communities and health systems, this should be a call to action to spread knowledge and increase efforts to make services available to people.”
They analyzed 306 different regions across the United States where hospitals provide highly specialized care to Medicare beneficiaries.
Of the nearly 4.9 million older people studied, 419,646 had Alzheimer’s or another form of dementia, and about 143,000 of them were diagnosed in 2019.
They then created a way to determine the actual number of cases diagnosed in 2019 and compared that to the number they would expect to see based on statistical models.
This allowed researchers to see whether some regions were diagnosing more or fewer cases than expected.
They also looked at broader factors, such as the highest average level of education in an area, obesity and smoking rates, and people’s proximity to research centers, which could affect how often people are diagnosed.
The results were presented as a ratio comparing the actual number of diagnoses made in a region and the number of diagnoses that would be expected based on the age and health status of a population.
If the ratio is greater than 1.0, it means that more people are being diagnosed than expected, indicating high diagnostic intensity.
The prevalence of diagnosed dementia ranged from four per cent to a maximum of 14 per cent, depending on the region of hospital referral, and the rate of new dementia diagnoses in 2019 ranged from 1.7 per cent to 5.4 per cent.
The highest number of Alzheimer’s and dementia cases were found in the South, along the “stroke belt,” but there were some variations.
In parts of Mississippi, for example, there were fewer cases than researchers expected, while in central Texas there were many more.
This variability was at a national level and the gaps between neighbouring regions could be very wide.
For example, the diagnostic intensity in Portland, Oregon, was 1.2, meaning more diagnoses were made than expected.
But in Bend, Oregon, right next door, the diagnostic intensity was 0.8, indicating there were fewer diagnoses than expected.
The researchers did not give a region-by-region reasoning for the differences between documented and expected cases, but said it could come down to demographic differences such as the average ages and races of the populations there, access to screening and whether a person knows what signs to watch for.

The chart above shows the estimated projection of Alzheimer’s disease patients in the US through 2060.
These gaps were not unique to Oregon. Researchers could see them on a map of the entire country.
The diagnostic intensity in Gainesville, Florida, was about 1.1, but just to the south in rural Ocala, the diagnostic intensity was 0.9.
In Providence, Rhode Island, the rate was 0.8, but in Hartford, Connecticut, less than 100 miles to the west, the rate was 1.1.
Their findings were published in Alzheimer’s and dementia: Journal of the Alzheimer’s Association.
Some regional Alzheimer’s rates may also be underestimates, as people in different parts of the country face barriers to receiving proper care and diagnoses.
The researchers concluded: ‘These findings have important implications for future strategies aimed at improving case detection among these groups.
‘Furthermore, these findings raise important questions regarding the extent to which differences in health care access and practices may drive excessive variability in ADRD detection.’

