- How important is your car as a status symbol? A new study discovers…
Would you trade in your car because your friend or neighbor has a better model?
For a significant proportion of British drivers, the answer is yes.
More than a third of British car owners have decided to switch cars after envying someone else’s vehicle, new research claims.
What are the best and worst brands to own? A new survey of 90,000 UK drivers has the answer…
A new Carwow survey has revealed that 35 per cent of car owners admit they buy a new car because they prefer someone else’s.
Meanwhile, 70 percent admit to being jealous of another car, and more than half said they have felt that jealousy on numerous occasions.
While people admit they drive green with envy, Carwow looked at car purchasing decisions and the magnitude of importance some people place on the car they drive.
The study of 2,001 car owners showed that a vehicle is a statement of confidence, personality, purpose and success for UK drivers.
For drivers considering switching cars before an upcoming lifestyle change, 45 percent of respondents said doing so would help them feel more confident and successful, whether they are starting or growing a family, changing job or moving house.
And almost four in ten admit that changing their current car would “help them get more out of life.”
Last month, This is Money revealed which car brands UK drivers love most, with 90,000 motorists giving their opinion on how satisfied they are with the brand of vehicle they drive.
The survey of UK drivers was carried out by Auto Express as part of its annual Driver Power survey and respondents were asked to rate their level of satisfaction on 36 different attributes for cars up to three years old.
Car owners were asked to rate their vehicles based on powertrain, exterior appearance, interior quality and engine practicality, as well as handling, safety and reliability, as well as many other categories.
These results were then aggregated to produce an overall score out of 100 and decide the ranking of the brands.
Land Rover came in 10th with a score of 87.63 percent, while its sister brand Jaguar just moved into ninth place with 87.72 percent.
The more affordable Toyota, Mazda, Peugeot and Citroën occupied the midfield with 87.84 percent, 88.01 percent, 88.03 percent and 88.22 percent respectively.
The always coveted Porsche came in fourth place with 89.16 percent, being the first German luxury brand to reach the top 10.
Kia took bronze with 89.35 percent, while all-electric vehicle favorite Tesla took silver.
Elon Musk’s electric vehicle brand earned a whopping 90.55 percent satisfaction rating.
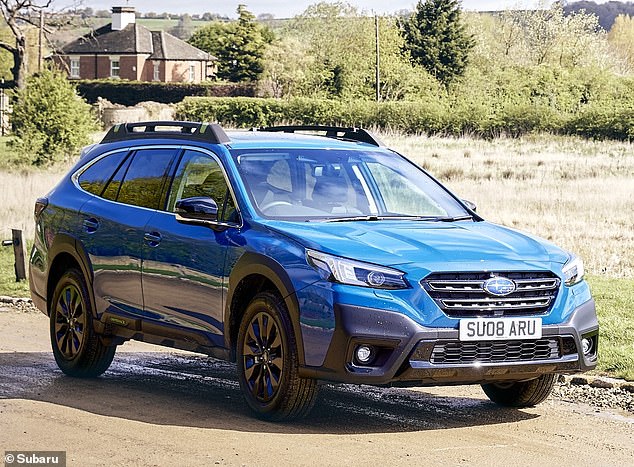
But in first place was, perhaps to some surprise, Subaru, which obtained a 90.66 percent satisfaction rate to win the gold medal.

Subaru, an often overlooked car brand, ranked highest in owner satisfaction with an overall score of 90.66%. It was voted the best of all manufacturers in five different categories.
Here is the full list of winners and losers:

