From the Thames to the Severn, Britain is home to some of the most beautiful rivers in the world.
But while these waterways may look pretty, many hide shocking levels of pollution.
A new interactive map from the Rivers Trust reveals the “desperate” condition of the UK’s rivers, with not a single stretch in England in “good” or “high” condition.
Some forms of pollution are evident from the riverbank, including plastic bottles bobbing in the water and wet wipes tangled in overhanging vegetation.
But appearances can be deceiving, as even the clearest waters contain microplastics, fertilizers and even pharmaceuticals.
Your browser does not support iframes.
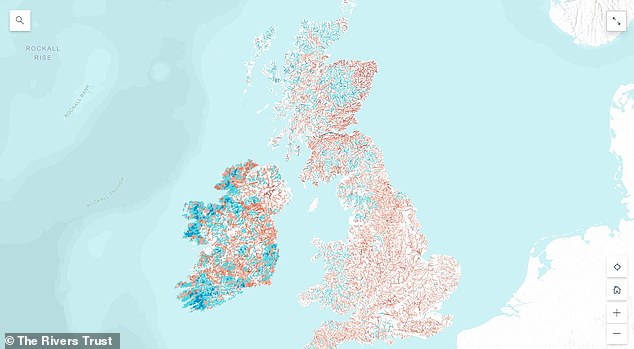
This shocking interactive map of the UK shows how our nation’s waterways have fallen into a ‘desperate’ state of health.
The interactive map shows the ecological health score for each stretch of the UK river.
This score looks broadly at what lives in the river and how modified the waterway has been by humans.
In general, the Rivers Trust notes that the absence or abundance of species is a good indicator of the overall health of the river.
These scores are rated on a scale ranging from high, shown in dark blue, to poor, shown in red.
As you can see from the large amount of red on the map, most of the UK’s waterways are in moderate ecological condition or worse.
As you zoom in, the map reveals even more details.
For example, it can be seen that almost all stretches of river surrounding London are rated as moderate or worse, and some stretches, including those between Egham and Teddington, are rated as poor.
Meanwhile, in the north of England, several bodies of water in the Peak District maintain their ‘good’ rating, while waterways around Manchester, Liverpool and Nottingham are largely moderate or worse.
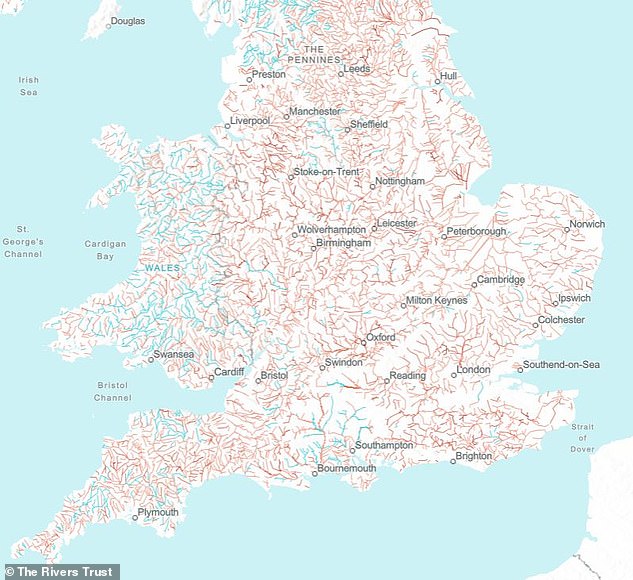

Waterways marked in red do not achieve “good” or “high” environmental health scores. Areas around London and the Midlands score poorly, while Wales has much healthier waterways.
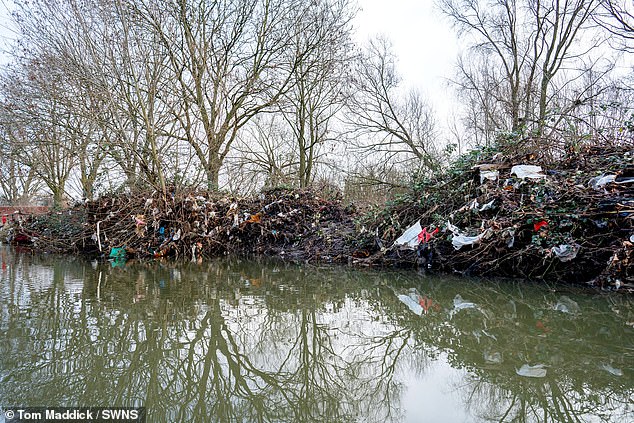

This image shows rubbish strewn across the River Soar, Leicester, following the January floods. The Rivers Trust notes that no English waterways score good or high in terms of overall health
In terms of ecological health, the rivers of Scotland, Wales and Ireland are faring much better than the waterways of England.
Much of Wales and Ireland are highlighted in blue, reflecting greater biodiversity in these areas.
To find the waterway closest to you, click on the search bar in the top left corner of the map.
When you enter the first letters of your city, town or street, suggestions will appear in the drop-down box below for you to select.
Clicking on these options will center the map on that location so you can search for the nearest waterway.
For more information, simply tap the river you want information about.
This will tell you when the last ecological study was done and what the channel score was.
For an even more detailed analysis, you can follow the link to the Catchment Data Explorer to learn more about the levels of invertebrates and chemicals in the water.
The Rivers Trust’s ‘State of Our Rivers Report’ examined the ecological and chemical health of the UK’s waterways to give each stretch of water a combined health score.
Of the 3,553 river stretches in England, none achieved a combined score of good or high for health, nor did any river in Ireland.
In Scotland, however, 57 per cent of rivers achieved an overall good condition, as did 44 per cent in Wales.
This report comes as the Government seeks to create 26 new swimming sites in England to cater for the growing popularity of outdoor swimming.
The sites would receive increased water monitoring and a greater focus on investigating sources of contamination from water companies and agricultural sites.
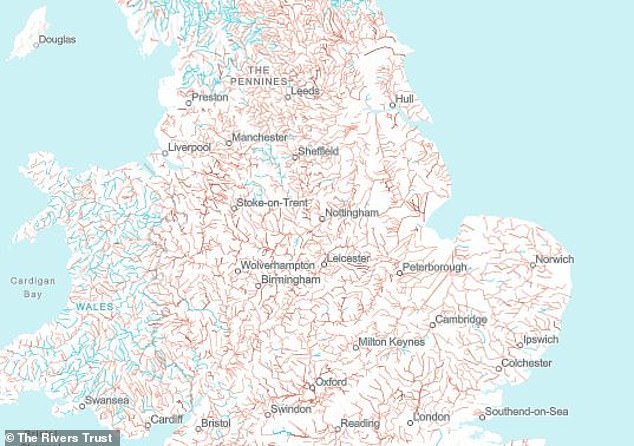

In the north of England, there were a few rivers in good health surrounding the Peak District, but around the major towns the rivers are mainly rated as moderate or worse.
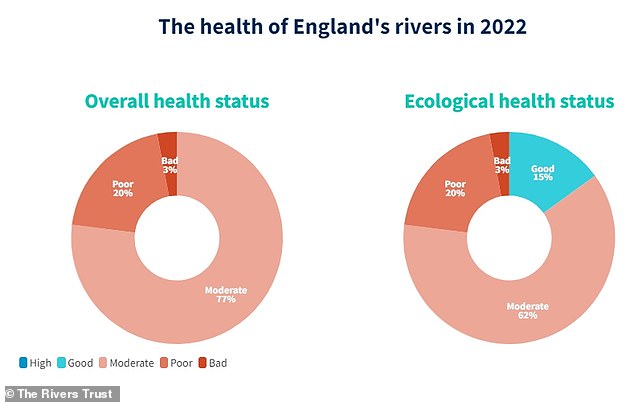

All English rivers have chemical health problems and only 15 per cent are in good ecological condition, report warns
Rivers Trust chief executive Mark Lloyd warned the findings were “dishearteningly similar” to the first such study the organization published three years ago for England, using previous data from 2019.
“We haven’t seen any dramatic improvement and the same problems are still there,” he said.
“Despite all the announcements, initiatives, press releases, changes of ministers and all that, we have not seen any needle change on the dial of a health measure, which shows that our rivers are in a desperate condition.”
Between 2019 and 2022, 151 river stretches improved and rose in an ecological standard, but 158 actually worsened.
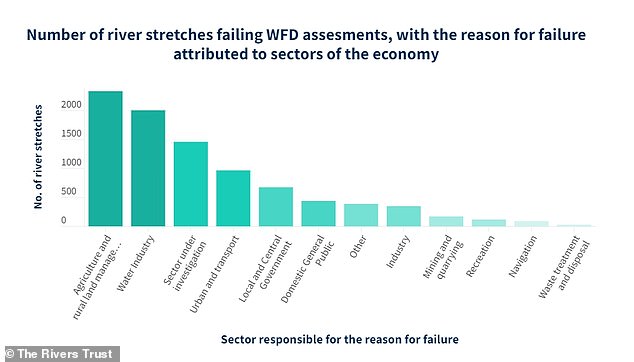

The report is based on data collected under the Water Framework Directive in 2022 and additional data sets for some areas.
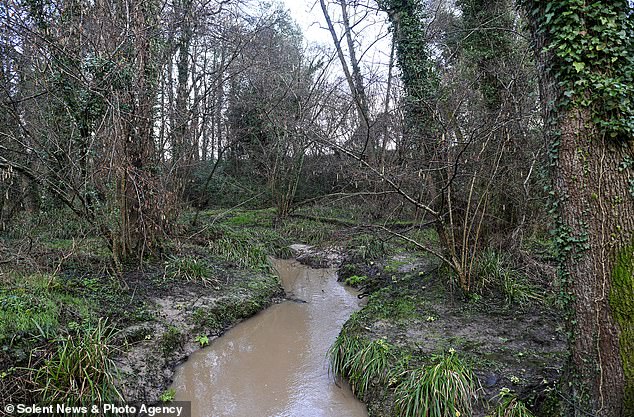

At Shawfords Lake Stream (pictured), raw sewage has killed more than 2,000 fish after a pump failed for 19 hours.
As to why so many waterways in England failed to achieve good ecological status, the Rivers Trust identified three key reasons.
Of all the rivers that failed their ecological tests, 62 percent did so due to factors associated with “agriculture and rural land management,” which primarily involves nutrient runoff from fertilizers and livestock.
The “water industry” and its wastewater discharges caused 54 percent of rivers to fail and 26 percent to fail due to runoff of transportation pollutants, such as oil, from roads.
However, the data also revealed some “concerning” gaps.
Of the rivers that failed, 39 percent had a failure that is unknown and is currently under investigation.
Likewise, the Rivers Trust also revealed that river sampling has decreased, with almost 6 per cent fewer rivers receiving health ratings compared to 2019.
To find out more about how wastewater affects your local waterway, you can also use the River Trust’s interactive map below.
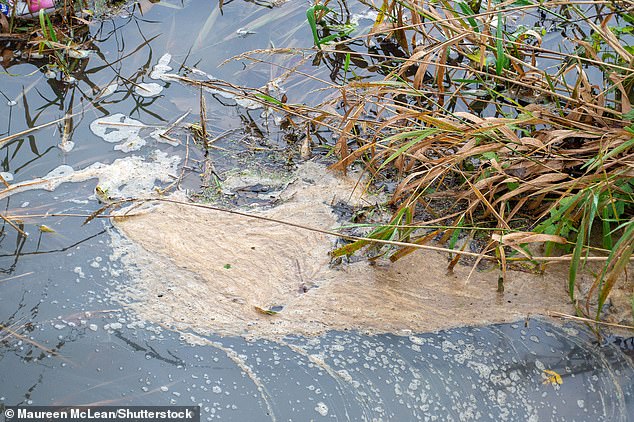

The discharge of wastewater largely contributed to rivers failing to meet their ecological goals. Here in Old Windsor, Berkshire Thames Water discharged sewage into the Thames for more than five hours
Your browser does not support iframes.
The data also shows that all rivers in England did not meet chemical health standards.
But when the Environment Agency came to study the rivers in 2019, it gave each stretch of river the status of “No assessment required”.
This is because all rivers failed in 2019, when the Environment Agency began testing for a group of chemicals called uPBT, which stands for “ubiquitous, persistent, bioaccumulative and toxic”.
Since these chemicals persist in waterways for decades, it is simply assumed that the chemical health of the water will remain poor.
