Table of Contents
- Average house prices rose 3.4% to £292,000 in the 12 months to October
The price of a typical house rose by around £10,000 in the year to October, according to the latest figures from the Office for National Statistics.
The average house in the UK now sells for an estimated price of £292,000, which is a 3.4 per cent increase on the same period last year, when the average property sold for £282,000.
While house prices have been rising for most of the year, they have fallen by £1,000 since August and prices fell in four of nine English regions compared to September.
According to the ONS, the North East, West Midlands and South East all recorded price falls between September and October.
In London, the average property fell by £7,000 between September and October and prices are now down £11,000 in two months.
The average property in the capital cost £520,000 in October, according to the ONS, up from £531,000 in August.
London falling: prices in the capital have dropped £11,000 on average over the last two months
Jonathan Hopper, chief executive of estate agency Garrington Property Finders, said: ‘On an annual basis, across all parts of the UK average prices rose in October. But if we dig deeper into today’s official data, the momentum looks less certain.
‘Although there is no shortage of buyers, those planning a move are increasingly pragmatic and price-sensitive.
“This sense of caution is likely to increase following the sharp rise in consumer inflation in November, which is eating into people’s disposable income and could delay next year’s long-awaited interest rate cut.
‘As a result, we are seeing some buyers re-evaluating what they can afford. The glut of homes for sale means they are often spoiled for choice, and this gives them the confidence and leverage they need to negotiate hard on price.
Why have house prices risen over the last year?
The overall upward trend over the past 12 months is believed to have been driven by falling mortgage rates in recent months, but concerns about higher inflation and a further rate hike could slow future growth, experts say. .
The ONS figures are published late compared to other house price indices, but are considered more accurate because they are based on completed sales.
In September, mortgage rates fell to lows not seen since before Liz Truss’ mini-Budget at the end of 2022, sending markets reeling.
The five-year low reached 3.68 percent, while the two-year low fell to 3.82 percent, although these averages have risen again since October and are now back above 4 percent. hundred.
Where did house prices rise the most this year?
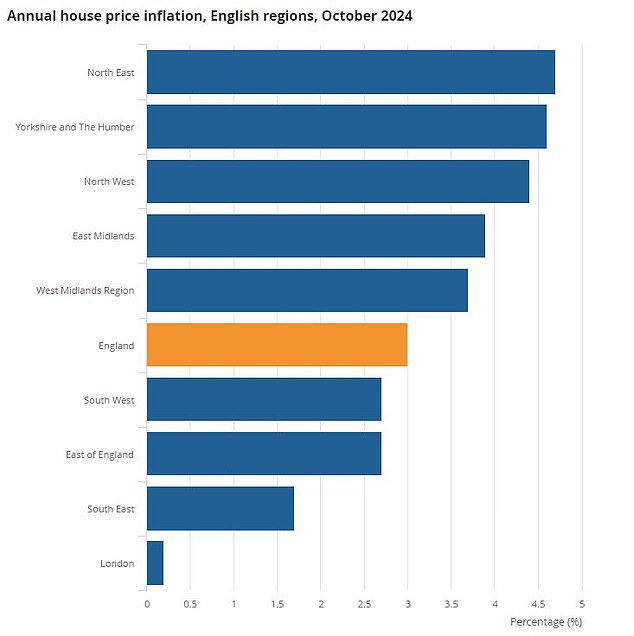
That said, the rate of house price growth varies across the country.
London has seen the lowest house price growth, at 0.2 per cent, while Scotland has seen median values rise by 5.1 per cent.
In Northern Ireland prices have risen even further, up 6.2 per cent over the year, according to the latest ONS data.
In England, it is the north where prices have increased the most.
The North East and Yorkshire and The Humber have seen average prices rise by 4.7 and 4.6 per cent respectively, year on year.
In contrast, in the southeast, prices grew by only 1.7 percent year-on-year, while in the southwest, growth was below average at 2.7 percent.


